Decoded - Mapping a Home for Every Child, Part 4: How Far to the Goal?
Wonk Premium Brief: Decoded
Mapping a Home for Every Child, Part 4: How Far to the Goal?
By Laura Radel, Senior Contributor
Part 1 of this series mapped where every state stood in 2025 on ACF's Home for Every Child (HFEC) ratio goal, which targets a 1:1 ratio of homes to children in foster care.
Part 2 tracked how those ratios changed between 2020 and 2025, finding that even the field's strongest performers over that period would fall short of the goal by 2030 if trends held.
Part 3 organized every state by the mechanism that actually moved its ratio: whether change came from caseload decline, home supply growth, home supply erosion, or some combination.
Together, those analyses gave us a sense of where every state is starting, what its recent dynamics looked like, and what drove them.
This piece adds the final dimension on where states are going and how to get there:
How many additional foster homes or fewer children in foster care would it take for each state to achieve the 1:1 goal?
THE MATH
The HFEC ratio is a simple division problem: the number of foster homes divided by the number of children in foster care.
To achieve the 1:1 ratio, a state needs at least as many homes as children in care. The gap is the difference between those two counts.
The gap can be closed by any combination of additional homes and fewer children.
For instance, in a state with a gap of 1,000, it could reach the goal ratio by decreasing its foster care population by 1,000, increasing the number of foster homes by 1,000, or any other combination of the two that adds to 1,000.
The math also works in reverse.
If the number of foster homes decreases, the caseload must fall far enough to cover both the original gap and the home loss.
That’s not a hypothetical; 40 states saw a decline between 2020 and 2025 —
If the caseload grows, the gap widens by an equivalent amount.
THE GAP
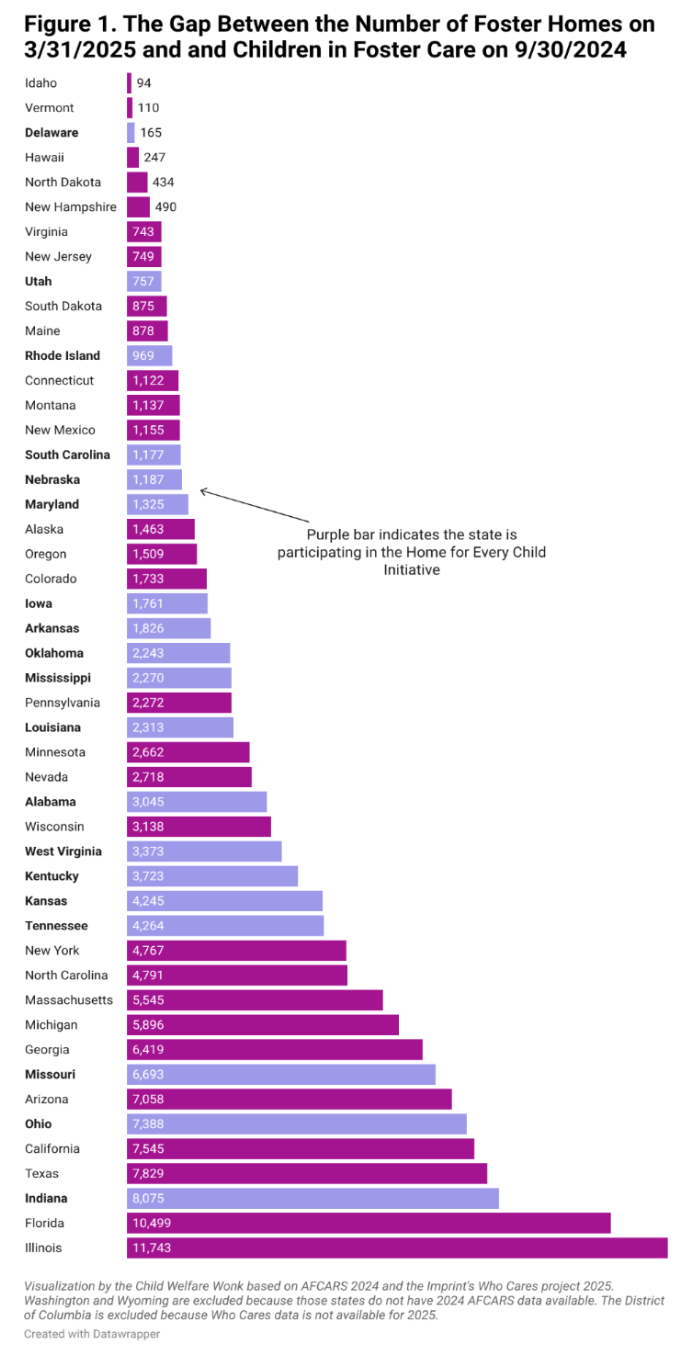
Figure 1 shows the numerical gaps between the counts of foster homes and foster children in each state for 2025.
For 8 mostly small states, such as Idaho, Vermont and Delaware, that gap is less than 500.
In 11 mostly large states, the gap is greater than 5,000, including two — Florida and Illinois — in which the gap is greater than 10,000. Other states are somewhere in between.
THE NUMERATOR STRATEGY: INCREASING THE NUMBER OF FOSTER HOMES
Figure 2 presents the gap as a percentage of each state’s 2025 stock of foster homes, assuming the number of children in foster care remains stable.
States with relatively small gaps would need to increase their supply of foster homes by 25 percent or less. This includes:
Idaho (8 percent)
Vermont (14 percent)
Virginia (16 percent)
California (24 percent)
Pennsylvania (25 percent)
States with the largest gaps would need to more than double their current home supply — and in Arizona’s case, nearly quadruple it. This includes:
Indiana (210 percent)
Kansas (221 percent)
Nevada (225 percent)
Arizona (368 percent)
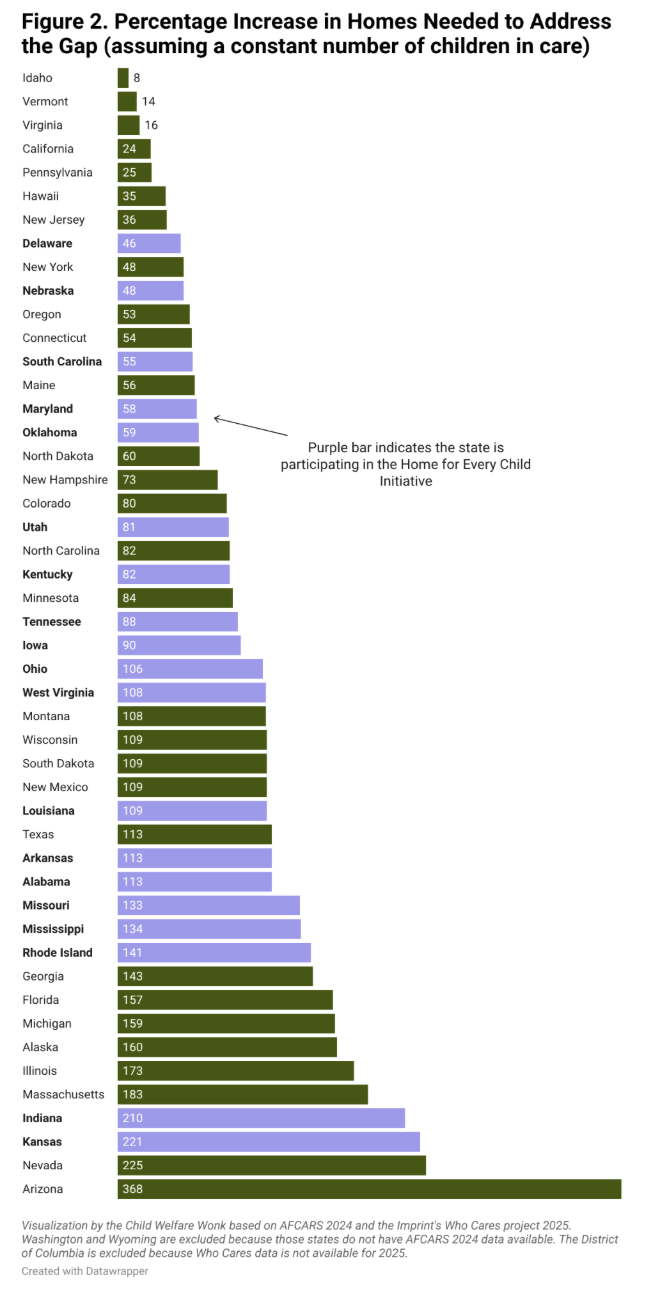
For context, Alabama and Nebraska — the two states that improved their ratios primarily through recruitment between 2020 and 2025 — grew their home supply by roughly 30 and 60 percent respectively over five years. For most states, a numerator-only strategy is not a realistic path to 1:1.
THE DENOMINATOR STRATEGY: REDUCING THE USE OF FOSTER CARE
The other path to a 1-to-1 ratio is reducing the number of children in foster care, whether through prevention, reunification, or other permanency.
Many states have already seen significant decreases in their foster care populations, which may make further reductions more challenging.
But states vary considerably in how much reduction would be needed to reach the goal.
Figure 3 illustrates the percentage reduction needed in each state to reach the ratio goal, assuming the number of foster homes remains constant.
Reductions needed range from 7 percent in Idaho to 79 percent in Arizona.
The same states that faced the smallest numerator challenge face the smallest denominator challenge:
Idaho (7 percent)
Vermont (12 percent)
Virginia (14 percent)
Pennsylvania (20 percent)
California (20 percent)
States with the biggest gaps would need to reduce foster care caseloads by 65 percent or more:
Massachusetts (65 percent)
Indiana (68 percent)
Nevada (69 percent)
Kansas (69 percent)
Arizona (79 percent)
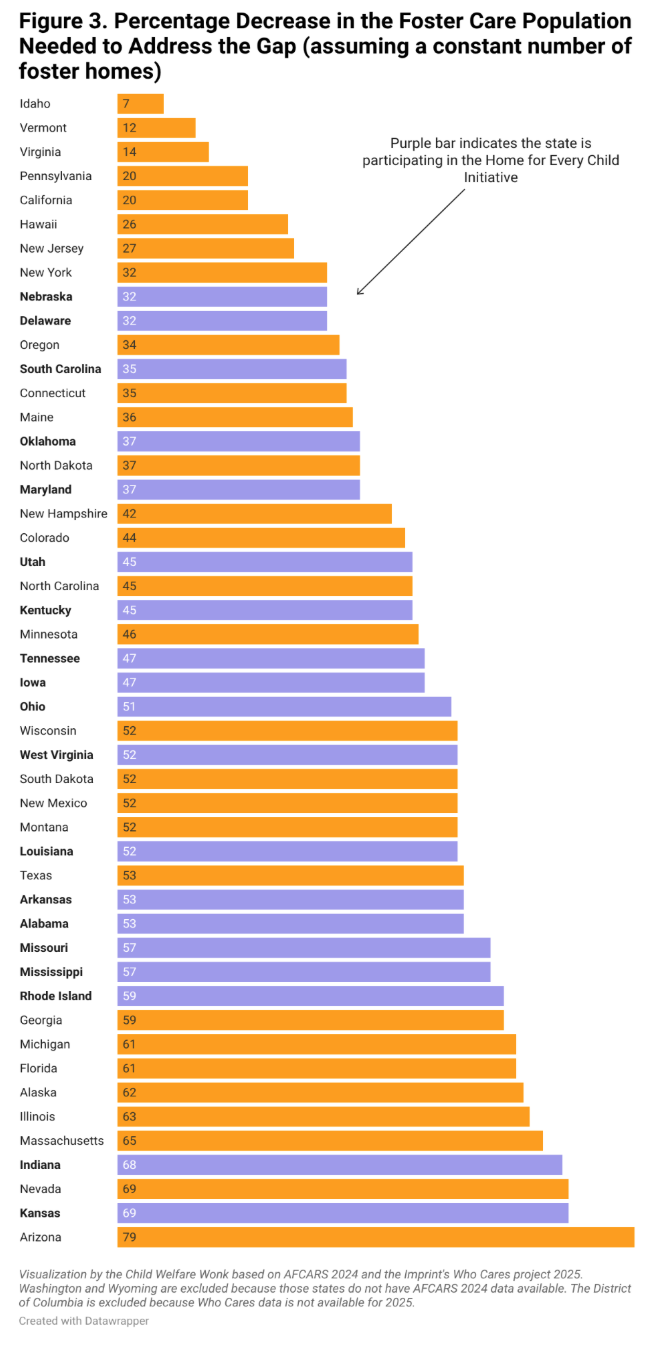
For context, Texas — the strongest denominator performer in the data — reduced its foster care population by 53 percent over five years from 2019 to 2024.
That represents the outer edge of what the field has demonstrated as achievable. Several states would need to match or exceed it.
TAKING UP THE CHALLENGE
As of this writing, approximately 19 states and the District of Columbia are participating in ACF’s Home for Every Child challenge, shown as purple bars in each figure.
Only two states among those with the ten largest numerical gaps (Indiana and Missouri) and two states among those with the ten largest percentage gaps (Indiana and Kansas) have elected to join.
The states that have stepped forward so far are, on the whole, not the states with the most proverbial ground to cover.
That may reflect differing strategic calculations: states more likely to show early progress may have an easier pathway to yes, especially as the first adopters.
It may also reflect the early stage of the initiative, with participation still taking shape.
It appears ACF’s new Home for Every Child Innovation Challenge will be tied to participation, which is a dynamic worth watching.
Either way, the gap data makes clear that meaningful national progress toward 1:1 will require engagement from states that have so far stayed on the sidelines.