Decoded - Mapping a Home for Every Child, Part 3: What's Driving the Ratio
Wonk PremiumBrief: Decoded
Mapping a Home for Every Child, Part 3:What's Driving the Ratio
The same ratio movement can mean very different things. Which lever is moving yours?
By Laura Radel, Senior Contributor, and Andrés Argüello, Director of Narrative Intelligence
Part 1 of this series mapped where every state stands today on ACF's Home for Every Child (HFEC) ratio goal. Part 2 showed how those ratios changed between 2020 and 2025.
This piece goes one layer deeper: what actually drove those changes.
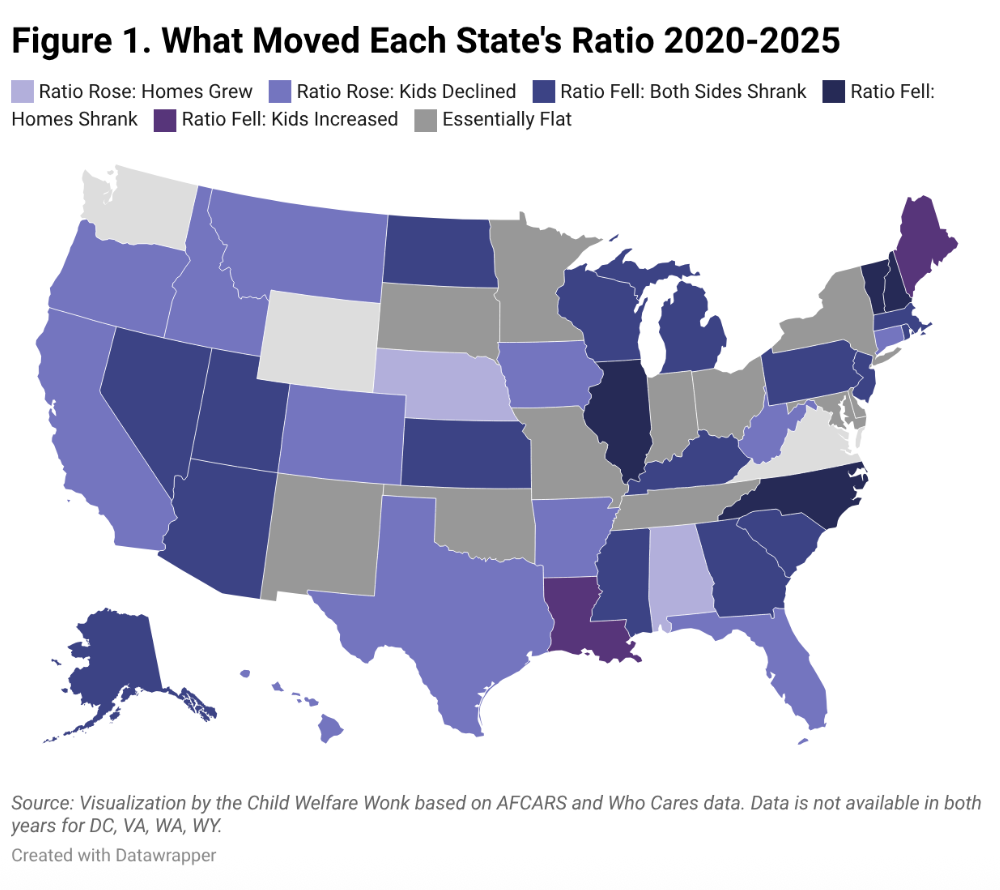
The map below organizes every state by the mechanism that moved — or failed to move — its ratio over the past five years.
Five categories emerge from the data, pointing to how states created their change. This isn’t an academic exercise; it’s key for effectively matching strategies to your reality.
THE TWO STATES THAT RECRUITED
THEIR WAY FORWARD
Only two states improved their ratios primarily by growing their supply of foster homes: Alabama and Nebraska.
Nebraska's change was the most significant in the country. Its ratio rose by 0.24, from 0.44 to 0.68 — a 53 percent increase — driven by a gain of 935 licensed foster homes.
Alabama added 618 homes against a modest caseload decline.
These are the clearest examples in the data of what a numerator strategy looks like in practice. They are also outliers.
TWELVE STATES WHERE FEWER KIDS MOVED THE NEEDLE
In 12 states, ratios improved primarily because foster care caseloads declined, not because more homes came online.The scale of caseload reduction varied widely. For example:
Texas saw 16,687 fewer children in foster care over the period, a53% decline, while losing 4,672 homes.
California saw 12,778 fewer children, a 25% decline, with homes essentially flat at +190.
Florida saw 7,365 fewer children while losing just 50 homes (less than 1%).
In each case, the caseload fell substantially faster than the home supply — by ratios of roughly 4-to-1 or more — which is what moved the ratio upward despite ongoing home losses.
Other states in this group saw smaller but still meaningful caseload reductions, with home losses that were proportionally similar or larger.
What drove those caseload declines is a separate question, and not one the ratio data alone can answer.
As we documented previously in our foster care decline series, caseload reductions reflect varying combinations of prevention investment, legal and administrative changes, pandemic-era disruption, and increased reliance on kinship care outside the formal system.
The mechanism behind the denominator matters, and it varies by state.
TWENTY-TWO STATES WHERE THE RATIO FELL
Twenty-two states saw their ratios decline between 2020 and 2025. Within that group, three distinct patterns appear.
In 16 states, both homes and children in foster care declined, but homes fell proportionally faster, pulling the ratio down. This is where retention can matter.
These states lost ground on the supply side even as their caseloads contracted.
Pennsylvania lost 5,899 foster homes over the period, the largest absolute loss in the country, while also seeing 4,269 fewer children in care. Nine states saw a contraction of 40 percent or greater.
In four states — Illinois, New Hampshire, North Carolina, and Vermont — the ratio fell primarily because of home supply decline, with caseloads essentially stable.
Vermont's ratio dropped 0.27, the steepest decline nationally, against a loss of 637 homes.
In two states, Louisiana and Maine, the ratio fell while foster care caseloads actually grew. Both home supply and caseload moved in the wrong direction simultaneously.
ELEVEN STATES ESSENTIALLY FLAT
In 11 states, the ratio moved less than 0.05 in either direction between 2020 and 2025. That stability can obscure significant underlying movement. Indiana, for example, lost 1,871 foster homes and saw
4,395 fewer children in care. Substantial changes on both sides largely offset each other in the ratio.
WHAT THIS MEANS FOR LEADERS
The map describes where each state has been. For states now preparing to engage with HFEC, formally or otherwise, it also raises practical questions worth addressing before building a plan.
First: which lever has been moving your ratio, and how much control do you actually have over it?
A state whose ratio improved because of caseload decline could be seeing the results of its own prevention strategies, but could also be benefitting from a trend it may not fully own, such as changes in behavioral health treatment access or affordable housing supply.
A state whose ratio fell because of home supply erosion has a more concrete, addressable retention problem, but one that will require deliberate action to reverse.
Second: Even if your ratio was steady or rising, do you have indicators of potential future risk exposure?
Forty states lost foster homes between 2020 and 2025. In many of them, that loss was masked in the headline ratio by caseloads concurrently falling.
That masking effect won't last indefinitely. If caseload trends level off or reverse, the supply contraction will become more visible and more consequential.
Understanding what category your state is in is not an abstract exercise. It is the starting point for an honest conversation about what a credible path to a 1-to-1 ratio actually requires.
In Part 4, we will examine the gap each state actually needs to close — and what scale of change on each lever would be required to get there.