Decoded - Mapping a Home for Every Child, Part 2: Back to the Future
Wonk PremiumBrief: Decoded
Mapping a Home for Every Child, Part 2: Back to the Future
How each state’s ratio shifted in recent years, as they prepare for the effort ahead.
By Laura Radel, Senior Contributor
Part I of this series mapped where each state stands today on ACF’s Home for Every Child (HFEC) ratio goal.
This piece looks at how those ratios have changed over the past five years – from 2020 to 2025 – and what that trajectory reveals about each state’s distance between current momentum and the target ratio of at least 1-to-1.
The short answer: the scale of the challenge is larger than five years of recent movement suggests.
Sixteen states increased their ratios between 2020 and 2025. Eleven did so by 0.1 or more.
Those are the field's best performers over the past five years. To reach the 1-to-1 goal by 2030, most states would need to far outpace even them.
The Movement Nationally
Nationally, the ratio rose 8 percent between 2020 and 2025, from 0.50 to 0.54. At the state level, the picture varies widely.
Where Ratios Rose…
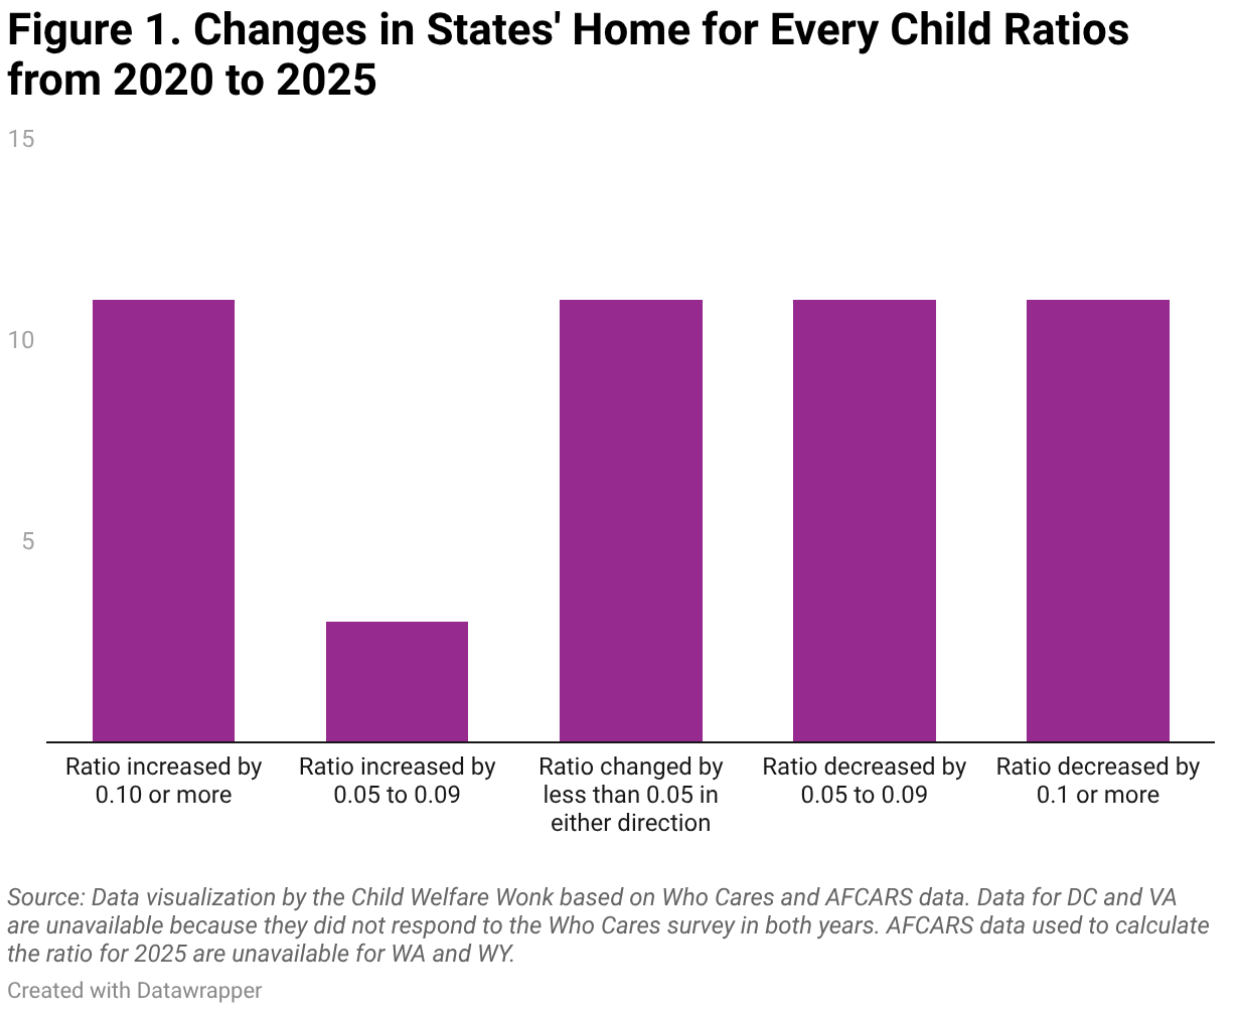
As shown in Figure 1,14 states increased their ratios during this period by at least 0.05.
11 of those states increased their ratios by 0.1 or more. Percentage increases in these states ranged from 8 percent to 60 percent.
The states with the greatest increases were :
_________________________
(1)Since publication of part 1 in this series, further analysis revealed both an error in my initial calculation of the ratio change for one state (Washington) and that the substitute data used for both Washington and Wyoming (which did not submit AFCARS data for 2024) had produced results that suggested potential data comparability issues.
Therefore, in the analysis for this piece and the future part 3, those two states have been dropped.
Nebraska, whose ratio increased by 0.24 (by 53 percent), from 0.44 to 0.68
Idaho, whose ratio increased by 0.21 (by 29 percent), from 0.72 to 0.93
California, whose ratio increased by 0.20 (by 34 percent), from 0.60 to 0.80
Colorado, whose ratio increased by 0.18 (by 44 percent), from 0.38 to 0.56
Connecticut, whose ratio increased by 0.18 (by 35 percent), from 0.47 to 0.65
Montana, whose ratio increased by 0.18 (by 52 percent), from 0.30 to 0.48
…and Where Ratios Were Flat or Fell
Ratios in 11 states were essentially flat, moving less than 0.05 in either direction.
22 states saw declining ratios.
Eleven of those fell by 0.1 or more. In percentage terms, declines in these states ranged from 9 percent to 41 percent.
The states with the greatest declines were:
Vermont, whose ratio fell by 0.27 (by 24 percent), from 1.15 to 0.88
Massachusetts, whose ratios fell by 0.24 (by 41 percent), from 0.60 to 0.35
Pennsylvania, whose ratios fell by 0.16 (by 17 percent), from 0.96 to 0.80
Rhode Island, whose ratios fell by 0.16 (by 28 percent), from 0.58 to 0.41
New Jersey, whose ratios fell by 0.14 (by 16 percent), from 0.87 to 0.73
Mapping the Change
Figure 2 maps the changes for the states. An interactive form of it is here.
For most, trajectories were gradual — incremental year-over-year movement in one direction over five years.
However, several states saw significant year-to-year swings in their ratios.
For instance, Maryland’s ratio increased from 0.64 in 2020 to 0.86 in 2021 and then dropped back to 0.56 in 2022.
South Carolina’s ratio declined from 0.75 in 2021 to 0.30 in 2022, and Virginia’s ratio increased from 0.50 in 2022 to 0.94 in 2023.
Abrupt changes may reflect particularly active periods of either foster home recruitment or foster care prevention.
Alternatively, they may reflect policy changes, such as if a state implemented alternative kin licensing standards that quickly made some hidden foster care visible, or data systems issues, such as if inactive foster homes were purged from the state’s licensing data or a backlog of licensing applications was suddenly cleared.
In most cases, abrupt changes were driven primarily by changes in states’ reported counts of foster homes rather than changes in the state’s foster care population.
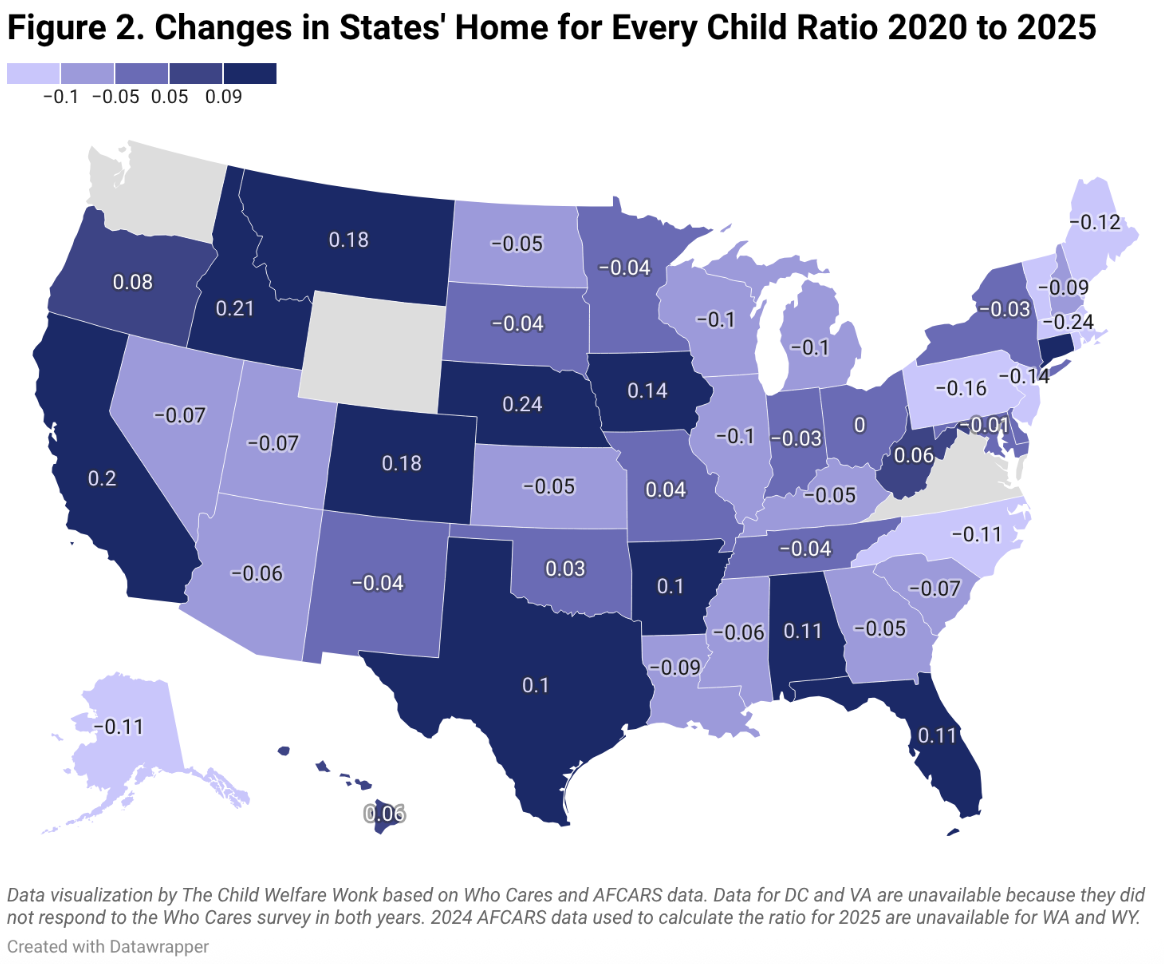
Figure 3 displays the magnitude differences among states.
What's Actually Moving the Ratio
Forty states reported fewer foster homes in 2025 than in 2020. Forty-six saw decreased foster care caseloads during that period.
These two trends, and the dynamics between them, drove the changes we see in states’ ratios.
Among the 14 states with increasing HFEC ratios:
Changes in 12 states were driven by declining foster care populations.
Changes in two states were driven by increasing numbers of foster homes (Alabama and Nebraska).
Among the 23 states with decreasing HFEC ratios:
17 states experienced a combination of both fewer children in foster care (which by itself would increase the ratio) and fewer foster homes (which would decrease the ratio), but on balance their ratios declined.
Changes in two states were driven by increasing numbers of children in foster care (Louisiana and Maine).
Changes in four states were driven by decreasing numbers of foster homes (Illinois, New Hampshire, North Carolina, and Vermont).
We’ll delve deeper into this data in Part III.
Shoot for the Moon: Distance to the Goal of 1 to1
Most states have a long way to go to meet the goal of a 1-to-1 ratio of foster homes to children in foster care.
The state that increased its HFEC ratio the most over the past five years was Nebraska, whose ratio increased by 0.24.
If all states achieved that magnitude of increase in their ratios over the next five years as a result of ACF’s initiative, just five states would reach the goal ratio:
California
Idaho
Pennsylvania
Vermont
Virginia.
Other states would range from 0.45 to 0.97, with many still a long way from achieving a 1-to-1 ratio.
Even if every state matched the field's best five-year gain, 43 would still fall short of 1-to-1 by 2030. Of those:
6 would reach a ratio of at least 0.90
8 would reach a ratio of between 0.8 and 0.9
15 would reach a ratio of between 0.7 and 0.8
Land Among the Stars? What the Data Tell Us
Five years of data reveal a field where movement is real but uneven, and where the drivers of that movement matter as much as the direction.
Most states that improved their ratios did so because fewer children entered foster care, not because more families stepped forward to become foster parents.
That points to strategies that already have proof of working, and the next layer that can build upon them.
For example, increased prevention reducing entries creates one layer of progress upon which stronger foster parent retention can further build closure of the gap.
In Part 3, we will map what drove those changes in each state, and what the mechanism behind the movement means for the work ahead.
___________________________
(2) Counts of states do not add to 50 (or 51 with the District of Columbia) because data is missing for Washington, Wyoming, and the District of Columbia