Decoded: Which States Are Most Likely to Place Kids in Care
By Laura Radel, Senior Contributor
Foster care is supposed to be reserved for situations in which a child’s safety can’t be secured any other way. In recent years foster care entries have declined nationally (Williams et al, 2025).
Behind national trends, states vary dramatically in how frequently they place children in foster care, far more than seems likely based on differential safety risks to children.
National figures – dominated by states with the highest populations, including New York and California – obscure state-level variation.
However, the new AFCARS Dashboard makes it easier than ever to compare states on a range of metrics, such as how frequently children and youth are placed in foster care.
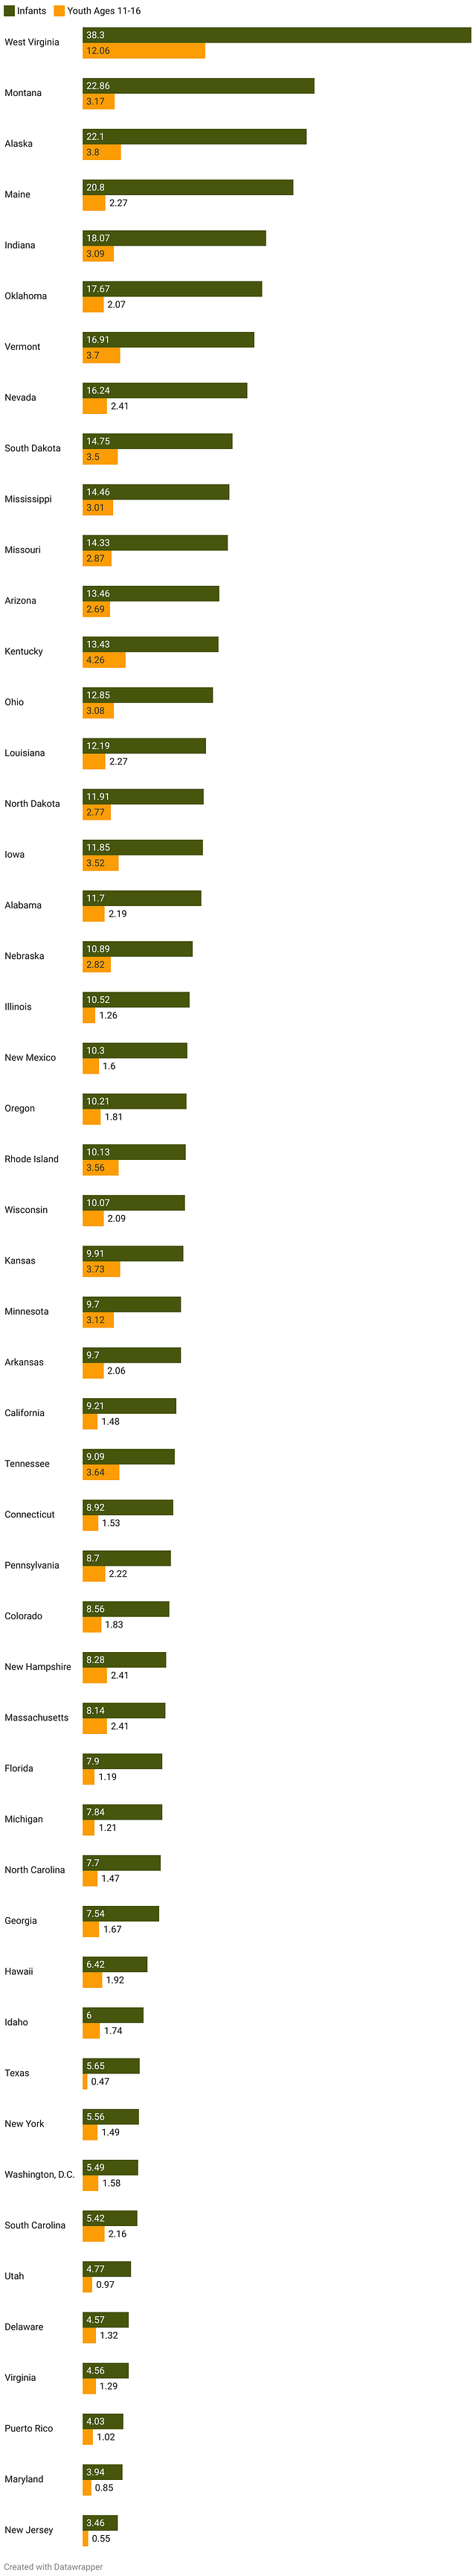
The variation among states is stark. AFCARS data for 2024 show extreme variations in foster care placement rates per 1,000 children in the state’s general population, particularly for infants. At the federal level, our focus on national trends hides informative differences among states.
For instance, are infants in Oklahoma really 3 times more likely to need foster care than infants in Texas?
Are infants in Maryland more than twice as likely to need foster care than those in Pennsylvania?
And why does West Virginia place infants roughly twice as often and youth three times as often as any other state?
Variation in safety factors are a start, but there’s likely a lot more that drives these differences – policy, practice, infrastructure and resource issues that underlie placement decisions.
Exploring the Ranges in Placement Rates
The bar graph below shows placement rates for two populations of children:
Infants (that is, children less than 1 year of age), and
Youth ages 11 to 16.
These age categories were selected because they are age groups upon which there has been particular policy and practice focus in recent years.
Nationally, the entry rate for infants in 2024 was 9.04 per 1,000 children and the rate for ages 11-16 was 1.83 per 1,000 (AFCARS Dashboard).
In every state, placement rates are much higher for infants than for youth. This is expected because infants are so much more vulnerable physically and this point has been recognized for many years (Wulczyn et al, 2002; Crouse et al, 2021).
Babies have always had high rates of placement relative to other age groups. But the differences among states are stark as well, ranging from a low of 3.46 children per thousand infants in New Jersey (roughly one-third the national rate) to a startling 38.3 per thousand in West Virginia (about 4 times the national rate).
Placement rates for youth also vary substantially, from 0.47 per thousand in Texas (roughly one-quarter the national rate) to 12.06 per thousand in West Virginia (more than six times the national rate). In both cases West Virginia is a substantial outlier with rates much higher than those of the next highest state.
States Have Distinct Placement Profiles
Most states rank similarly in their placement rates for both infants and youth.
10 states rank high (0-15th places) in placement rates for both age groups: Arkansas, Indiana, Kentucky, Mississippi, Missouri, Montana, Ohio, South Dakota, Vermont, and West Virginia.
12 states have moderate placement rates (ranking between 11th and 35th places) for both age groups: Alabama, Arkansas, Colorado, Louisiana, Massachusetts, Nebraska, New Hampshire, New Mexico, North Dakota, Oregon, Pennsylvania, and Wisconsin.
And 10 states rank low (36th through 50th places) in their rates of placement for both age groups: Delaware, District of Columbia, Maryland, Michigan, New Jersey, New York, North Carolina, Texas, Utah, and Virginia.
Interestingly, a smaller set of states have different placement patterns for infants and youth.
In 4 states, we see high placement rates only for infants: Arizona, Maine, Nevada and Oklahoma.
5 states have high placement rates only for youth: Iowa, Kansas, Minnesota, Rhode Island, and Tennessee.
4 states have low placement rates only for infants: Georgia, Hawaii, Idaho and South Carolina.
And, finally, 4 states have low placement rates only for youth: California, Connecticut, Florida, and Illinois.
In each case where rates are high or low for only one group, they are in the moderate range for the other group. There are no states high for one age group yet low for the other.
What Variation Reveals
Where differences are stark in metrics like this, national statistics are of limited value in federal policy making.
National policies need to recognize the full range of street-level realities in states. Therefore we must also look to factors that might drive the variation – the reasons behind the ranges.
Variations like these offer opportunities for reflection, particularly at the state and local levels, to consider differences in context that may explain outcomes – in this case decisions to place children at higher or lower rates than other child welfare systems.
At the surface level, there are red states and blue states at all points in the continuum, suggesting political ideology itself is unlikely determinative.
Most high placement states have been particularly hard hit by the opioid epidemic, and most are relatively rural states which may have limited social services infrastructure.
Past research on differences among states is limited, though one researcher has found that foster care placement rates are associated with the extent to which a state’s criminal justice system is punitively oriented and the relative generosity of its welfare programs (Edwards, 2016).
In addition, there are documented disparities in placement rates at the individual child level based on child demographics, particularly race and poverty (Wulczyn et al, 2023).
But many other factors are also likely at work, such as:
State definitions of concepts including maltreatment, harm, and imminent risk;
Policy and practices around topics such as relative care and prevention services;
Judicial and court practices;
Resource issues within the child welfare system, including workforce issues, the availability of foster homes, and IT infrastructure;
Resource issues in other systems such as the availability of treatment for mental health conditions and substance use, school supports, and so forth.
Recent tragic child maltreatment cases and the attendant media and public attention.
By examining variation we can start conversations about the factors that may drive outcomes, whether each of our systems is producing what we want, and what points of leverage we have that could be used to produce more or less of what we do and do not want in the child welfare system.
This will be an essential step as policymakers look ahead to what’s next in policy and financing.
References
Edwards, F (2016). Saving Children and Controlling Families: Punishment, Redistribution and Child Protection. https://doi.org/10.1177/0003122416638652
Wulczyn F, Hislop K and Harden B (2002). The Placement of Infants in Foster Care. https://doi.org/10.1002/imhj.10028
Crouse G, Ghertner R, Madden E, and Radel L (2021). Foster Care Entry Rates Grew Faster for Infants than for Children of Other Ages, 2011–2018. https://aspe.hhs.gov/reports/foster-care-entry-rates-2011-2018
Williams, SC, Rosenberg, R and Martinez, V (2025). State-level Data for Understanding Child Welfare in the United States. https://www.childtrends.org/publications/state-level-data-for-understanding-child-welfare-in-the-united-states
Wulczyn F, Zhou X, McClanahan J, Huhr S, Hislop K, Moore F, Rhodes E. Race, Poverty, and Foster Care Placement in the United States: Longitudinal and Cross-Sectional Perspectives. https://doi.org/10.3390/ijerph20166572