Data Drop: Amid Worsening Child Mental Health, Treatment Capacity for Children on Medicaid Declined in One-Third of States
Most states have less than two mental health facilities for every 1,000 children on Medicaid with a mental health condition, and 19 states had fewer facilities in 2023 than in 2021.
Robin Ghertner, MPP
BLUF:
Children’s mental health needs are rising–is treatment across states keeping pace? Our analysis indicates that in many states, it is not.
Medicaid is the backbone of mental health financing for children. 90% of mental health facilities accept Medicaid.
In 2023, there were 1.25 mental health facilities serving children on Medicaid per 1,000 children on Medicaid with needs.
But that coverage is uneven, and lowest in large-population states like Texas, Florida, and Georgia.
Most states have fewer than two mental health facilities per 1,000 children with a diagnosed condition who are on Medicaid.
Only 11 states have more than 2 facilities accepting Medicaid per 1,000 children.
From 2021-2023, nineteen states lost mental health facilities serving children on Medicaid, even as need increased.
California, Pennsylvania, and Virginia saw the sharpest declines.
The State of Children’s Mental Health Treatment Access
Wonk readers know the headline: children’s mental health needs are rising, and the increase is steepest for kids in foster care. Previous Wonk analysis surfaced that trend.
We also know that children on Medicaid - including almost all kids in foster care - have seen over a 50 percent increase in mental health conditions from 2010 to 2019 (Cummings et al, 2025).
What has been less clear is whether treatment systems are keeping pace.
Research has long pointed to availability as the weak link (AACAP, 2024). Facilities are scarce, and many depend on Medicaid reimbursement to stay open.
Our analysis found that in 2023, over 90 percent of mental health facilities serving children accept Medicaid.
The One Big Beautiful Bill Act includes a projected one trillion dollar Medicaid spending reduction. Depending on how states choose to respond to those cuts, and what financing ultimately looks like for facilities, even insured children could face shrinking options.
This raises a sharper question: as need rises amid financing pressures, what is the actual state of treatment access for children on Medicaid today — and which states are falling behind?
That’s the gap we set out to fill.
We went past prevalence data to ask whether treatment systems are keeping pace. The results show where access is thin, where it’s eroding, and where looming policy shifts could quicken erosion.
How We Analyzed the Numbers
We used the National Substance Use and Mental Health Services Survey (N-SUMHSS) to estimate state-level availability of treatment. The survey counts dedicated mental health facilities — clinics, hospitals, and residential programs whose primary focus is mental health treatment.
It does not capture general medical settings, schools, or community programs that only provide non-treatment mental health services. Nor does it account for facility size; a large hospital and a small clinic both count as “one.”
To allow comparing availability across states, we started with the number of facilities that both accept Medicaid payments and that serve children.
We then calculated the rate of facilities per 1,000 children on Medicaid who have a diagnosed mental health condition using the National Survey of Children’s Health. We focused on Medicaid because it is the dominant payer for child mental health treatment.
Full details on our approach are available in the Methods Appendix.
The Treatment Landscape: Thin and Uneven
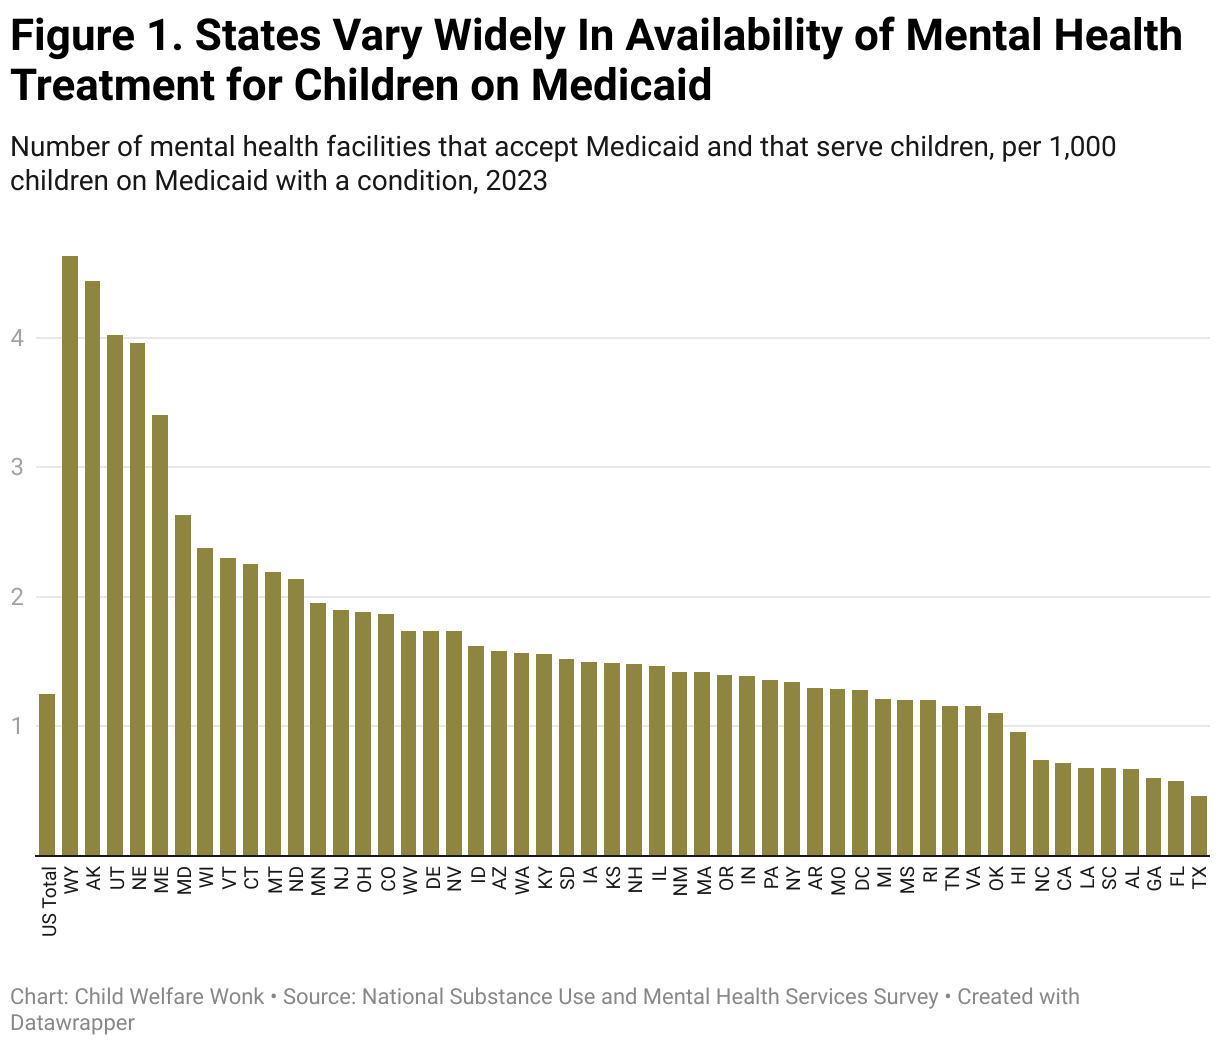
Nationally, there are less than two mental health facilities for every thousand kids on Medicaid who need care.
Figure 1 shows our national estimate: 1.25 mental health facilities per 1,000 children on Medicaid with a diagnosed condition.
That national rate masks a stark divide. Only 11 states have over 2 facilities per 1,000.
Only Wyoming, Alaska, Utah, Nebraska, and Maine have over 3 facilities per 1,000. These also happen to be geographically big states, with smaller child populations.
At the bottom, 8 states have less than 1 facility per 1,000 kids on Medicaid with a condition, with Texas, Florida, and Georgia have the lowest, despite having some of the largest child populations in the country.
The signal is clear: most states are under-resourced, with children on Medicaid having limited access to needed treatment.
Over One-Third of States Lost Mental Health Facilities for Children that Accept Medicaid
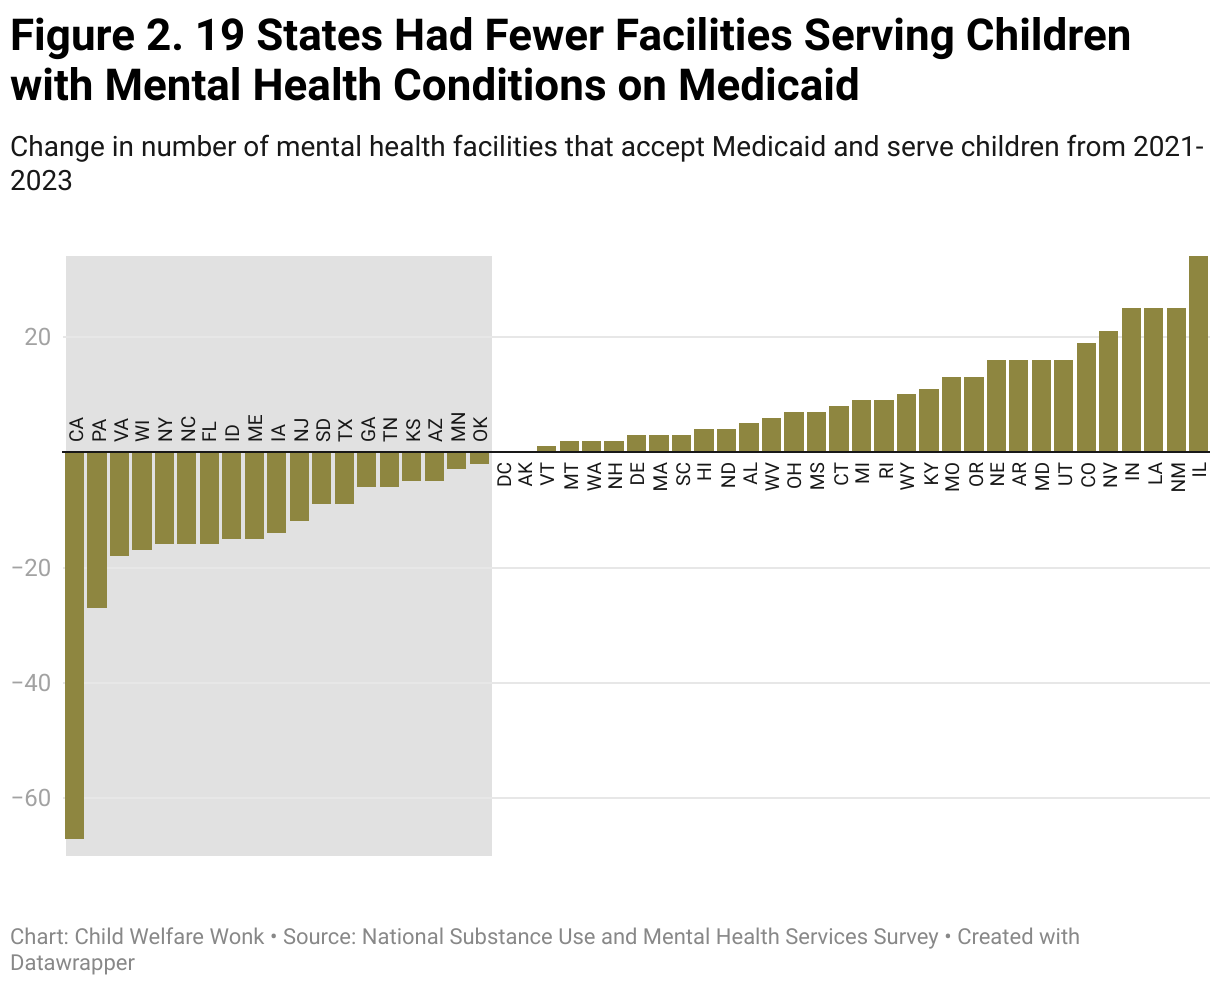
Nationwide, between 2021 and 2023 the number of facilities accepting Medicaid payments that also served children increased by 56. But again, that national increase hides uneven state trajectories.
Nineteen states had a net loss of facilities accepting Medicaid over the period, despite rising need.
Figure 2 lays out the changes in number of facilities accepting Medicaid that serve children by state. Though the figure focuses on facilities accepting Medicaid, the trends are similar for facilities accepting payment from any source.
Key findings include:
19 states had fewer facilities that accept Medicaid and serve children with mental health needs between 2021 and 2023.
The sharpest declines came in California, Pennsylvania, and Virginia, each losing at least 18 facilities.
On the other side, many states gained facilities during this time period. Illinois, New Mexico, Louisiana, and Indiana posted the largest gains, all adding at least 25 facilities accepting Medicaid.
The net effect is inconsistency: while some states expanded capacity, others are watching it erode.
The result is a patchwork where a child’s access to treatment depends less on their needs but rather on where they live.
Limitations: A Glimpse, Not the Whole Picture
These data provide signals, not a full map of access. Within-state variation can be dramatic. States like Alaska, Wyoming, and Maine top the charts in terms of availability, but large rural areas mean families may still have to drive hundreds of miles for in-person care.
Counting facilities also does not equal counting capacity. A large hospital and a small clinic both register as “one,” and facilities (regardless of size) may not have openings for new patients. An essential part of capacity is the workforce, which we know is facing shortages.
We didn’t look at a breakdown of facility type in this brief analysis, and may do so in a follow-on piece. Facilities can provide different services, in different settings, to children with different needs.
Still, the patterns matter. Even with these limitations, the data highlight where state treatment systems are most fragile — and where policy levers may be needed to stabilize or expand capacity.
Why This Matters for Decision-Makers
The map of facilities is more than a data point. It’s a stress test for child and family policy systems.
For child welfare leaders, the signal is straightforward: unmet mental health needs can drive foster care entries and disrupt permanency.
When treatment is scarce, the child welfare system may absorb children who might otherwise have stayed safely at home.
And reunifications can stall for lack of services.
For federal legislators, the findings show where federal choices on Medicaid will land hardest.
Nearly every facility serving children depends on Medicaid reimbursement.
The One Big Beautiful Bill Act cut projected Medicaid spending by nearly $1 trillion.
Even though it's not intended to reduce coverage for children, that scale won’t just trim budgets.
If mental health facilities cannot take the financial hit, it risks thinning out the network these children rely on.
States under pressure to absorb reductions may turn to cutting optional Medicaid benefits, which often include the services children with the most serious needs depend on.
One potential service that could be at risk: inpatient psychiatric services for individuals under age 21 — a critical but optional benefit that serves children in crisis.
For funders and philanthropy, the gaps identify leverage points.
States already short on facilities are least able to withstand federal shocks.
Targeted investments keep facilities open and well-staffed for children, and can keep a fragile system from breaking.
New financing and service delivery models for ensuring access to quality care will become even more valuable, as will policy ideas for filling this growing gap.
For state leaders, the picture underscores the mismatch between caseload growth and available support.
Facing a challenging fiscal climate, states must make choices about where to bolster shrinking federal dollars.
Children’s mental health does not just implicate one system - when treatment is unavailable or inaccessible, other children and family services feel the consequences.
The analysis also points to where more work is needed to dig into these trends in order to guide the appropriate course of action.
We need to understand more about why many states saw reductions in facilities, and how other states were able to increase their count.
The broader lesson is structural. Families face many barriers — cost, transportation, stigma — but those barriers can only be tackled if facilities exist and are financially viable.
Availability and Medicaid financing are levers decision-makers directly control.
The data show where those levers are already under strain, and where policy choices risk pushing the system from inadequate to unsustainable.
Methods
This study used data from two national data sources the National Substance Use and Mental Health Services Survey (N-SUMHSS) and the National Survey of Children’s Health (NSCH). The N-SUMHSS gathers data from all active mental health treatment facilities (for example, private for-profit; private nonprofit; and state, local, Tribal, and federal government) across the US regarding the services they offer, if they offer services for children and whether they accept patients with Medicaid coverage. The NSCH surveys non-institutionalized U.S. children between the ages of 0 to 17 on various health conditions and access to services.
To examine facility rates, we use the N-SUMHSS to count the number of facilities that accept payments from Medicaid and that serve children 0-17 in 2023. We use the NSCH to estimate the number of non-institutionalized US children between the ages of 0 to 17 with a diagnosed mental health or neurodevelopmental condition who are covered under Medicaid.
To get adequate sample size, we pooled data from the 2018-2023 NSCH surveys. While this was needed to get adequate sample, we know that diagnosis rates changed substantially from 2018-2023 nationally. Cross-state comparisons could be biased to the extent that changes in diagnosis rates differed across states. We calculate the facility rate as the number of facilities in a state per 1,000 children with a mental health condition who are covered by Medicaid. We report point estimates without confidence intervals. Differences between states should be interpreted cautiously given sampling variability in NSCH state-level estimates.
To examine change in facilities over time, we calculate counts from the N-SUMHSS for 2021 and 2023. We do not calculate rates, because the NSCH does not have adequate sample size for cross-state comparisons for single years.
Despite being the most comprehensive national surveys on their respective topics, these two data sets have some limitations. Data from the NSCH are subject to self-report biases; moreover, the NSCH does not include people who were unsheltered, incarcerated, or otherwise institutionalized at the time of the survey interview.
We rely on the NSCH to measure need, but the survey is unable to dig into the specific services needed, and the mental health facilities surveyed in the N-SUMHSS may not provide those services. The N-SUMHSS does not not include mental health treatment facilities operated by the Department of Defense, solo or small group practice not licensed or accredited as a mental health clinic or a mental health center, jail, prison, or detention center that provided treatment exclusively for incarcerated persons or juvenile detainees. N-SUMHSS is based on responses provided by treatment facility representatives and is a voluntary survey, and thus does not cover every facility in the US. The response rate for the 2023 survey was 85 percent, and for 2021 was 79 percent.
References
AACAP. (2024, April 10). Severe Shortage of CAPs Illustrated in AACAP Workforce Maps. https://www.aacap.org/AACAP/zLatest_News/Workforce_Maps_Illustrate_Severe_CAP_Shortage.aspx
Cummings, J. R., Hu, X., Marchak, J., Ramos, C., Graetz, I., & Ji, X. (2025). Trends in Mental Health Diagnoses Among Publicly Insured Children. JAMA, 333(22), 1988–1997. https://doi.org/10.1001/jama.2025.4605