Decoded: Mapping the Foster Care Decline
By Laura Radel, Senior Contributor, and Brett Greenfield
See the PDF version here, with full-page charts.
Last month, we examined the national decline in foster care caseloads, down 23 percent from the most recent peak in 2018.
But those declines are not self-explanatory.
They can signal prevention working, system capacity tightening, screening thresholds shifting, pandemic-era distortions – or some combination of all four.
Understanding what’s driving them matters for decision-makers.
In this piece, we look under the hood.
Rather than treating the national trend as a single story, we examine the eight states with the largest numerical declines in foster care between 2018 and 2023.
Together, these states account for 60 percent of the national decline.[1] If there is a structural shift underway, it shows up here first.
Not One Decline, But Several
Across the 8 states driving most of the national foster care decline, the topline numbers move in the same direction. The underlying dynamics do not.
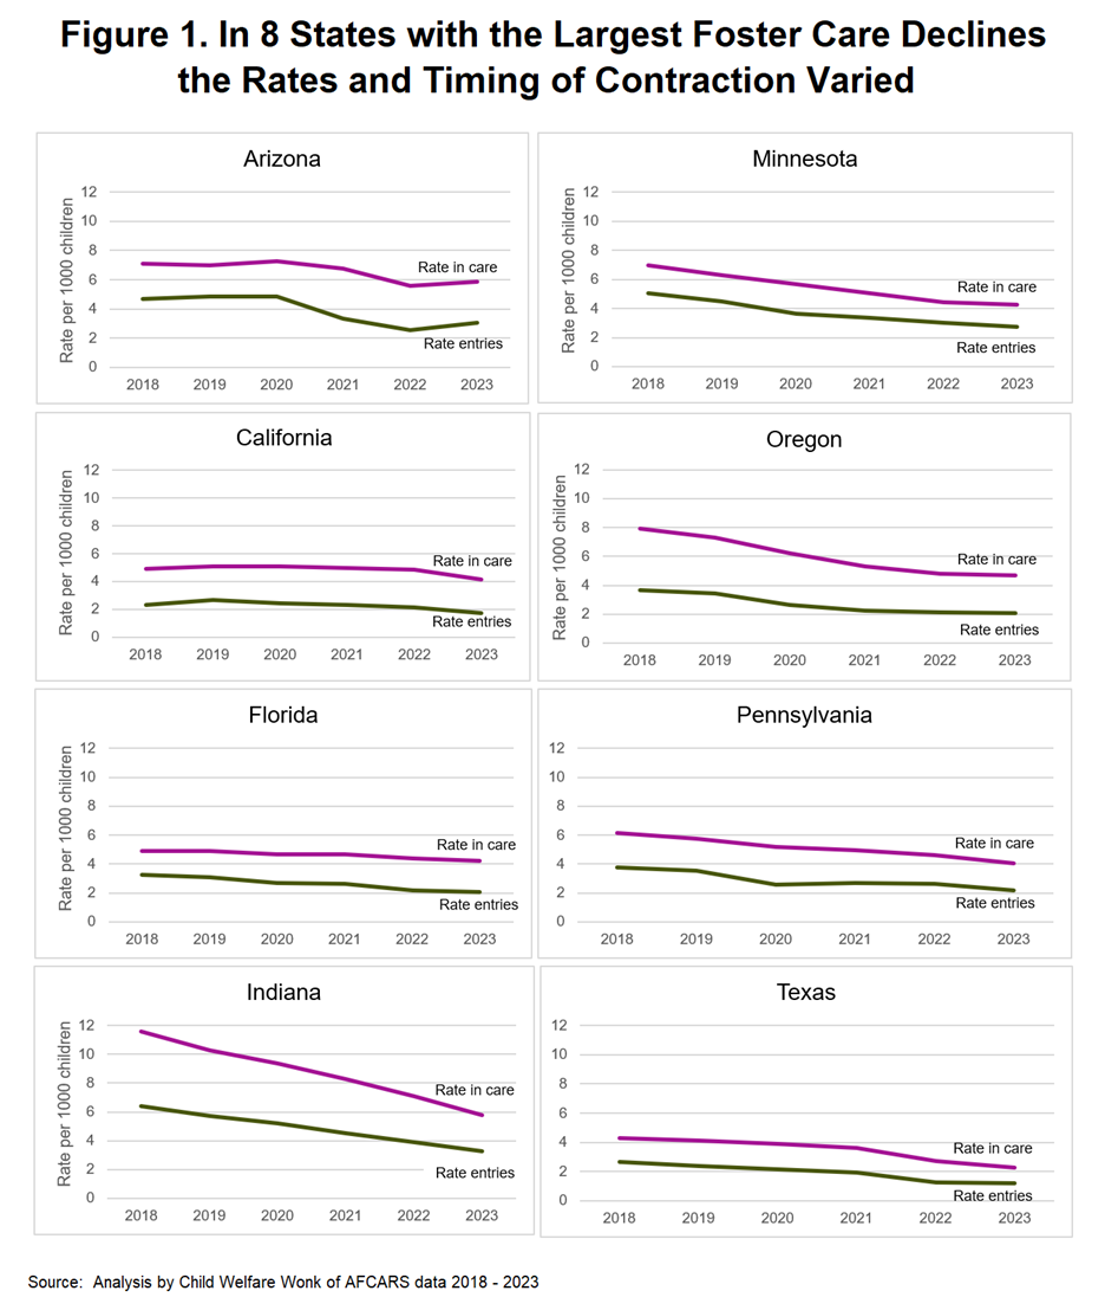
Each state experienced reductions in both the rate of foster care entries and the rate of children in care overall. But the relationship between those two trends varies in ways that matter.
Those variations cluster into patterns that point to different driving forces of the overall decline.
Across the Board Declines
In Indiana, Oregon, and Pennsylvania declines in entry rates closely tracked declines in the overall foster care population.
This pattern reflects relatively stable system dynamics as caseloads fall; not only did entries decline but that tracked with a corresponding rise in exits
Tilting Toward Front-End Focus
In California, Texas and Minnesota, declines in entries somewhat outpaced declines in the overall foster care population.
That pattern points to systems that slowed the inflow of children more quickly than they reduced the duration of stay or size of the population already in care.
This could point to increased narrowed intake, possibly from an emphasis on prevention, family preservation, and other front-end supports, or from administrative changes that narrowed the flow of children into care, with a smaller rise in exits.
Focusing on the Front-End
Arizona and Florida saw much larger decreases in entries than in their overall foster care populations – a pattern consistent with significant front-end contraction paired with slower exits.
This is suggestive of an emphasis on prevention, family preservation, and other efforts aimed at fewer removals, without a corresponding change in approach after children enter care.
These distinctions matter.
When declines are uniformly entry-driven but unevenly reflected in the total population, aggregate caseload reductions can obscure important differences in how systems are functioning – and in who remains in care as entries fall.
Timing of Declines
While all eight states experienced entry-driven declines in foster care, the timing of those reductions differed substantially.
In Indiana and Minnesota and Texas, declines in both entry rates and overall foster care rates were sustained from 2018 through 2023.
Indiana’s declines were particularly dramatic and sustained, starting from a much higher rate of children in care than the other states in the analysis.
Other states saw declines that were more episodic.
Arizona’s foster care entry rates remained relatively flat through 2019, fell sharply between 2020 and 2022, and then increased again in 2023.
Meanwhile, California’s rates dropped only between 2022 and 2023 – a later but numerically significant shift given the state’s size.
Florida and Pennsylvania experienced more modest declines overall, while Pennsylvania’s entries fell more steeply between 2019 and 2020 before leveling off.
Lastly, Oregon’s declines were concentrated between 2019 and 2021 before leveling off.
These timing patterns matter because they complicate simple interpretations of decline.
Sustained multi-year reductions raise different questions than sharp, time-bound drops that coincide with the COVID-19 pandemic and associated disruptions in reporting, investigation, and service access.
Treating both as equivalent indicators of system change risks overstating what the data can support.
Concurrent Safety Concerns
Large, entry-driven declines in foster care raise a predictable question: did other indicators of child safety shift at the same time?
This is important for understanding whether the shift reflects fewer kids coming into care that could safely remain at home, or whether more children are experiencing safety risk.
To examine that question, we examined three federal measures available across states and years: foster care re-entry, maltreatment recurrence, and child maltreatment fatalities.
These indicators are observed concurrently with foster care declines, however the data do not allow for causal inference.
Across all eight states, foster care re-entry rates declined modestly over the period.[2]
The decreases were consistent but small, suggesting that reductions in entries were not accompanied by higher short-term instability among children exiting care.
Maltreatment recurrence rates were relatively stable in six of the eight states – extremely stable in three states, up slightly in one state, and down slightly in two others.[3]
Meanwhile, Indiana saw a two-percentage point decrease in maltreatment recurrence while Arizona experienced a three-percentage point increase.
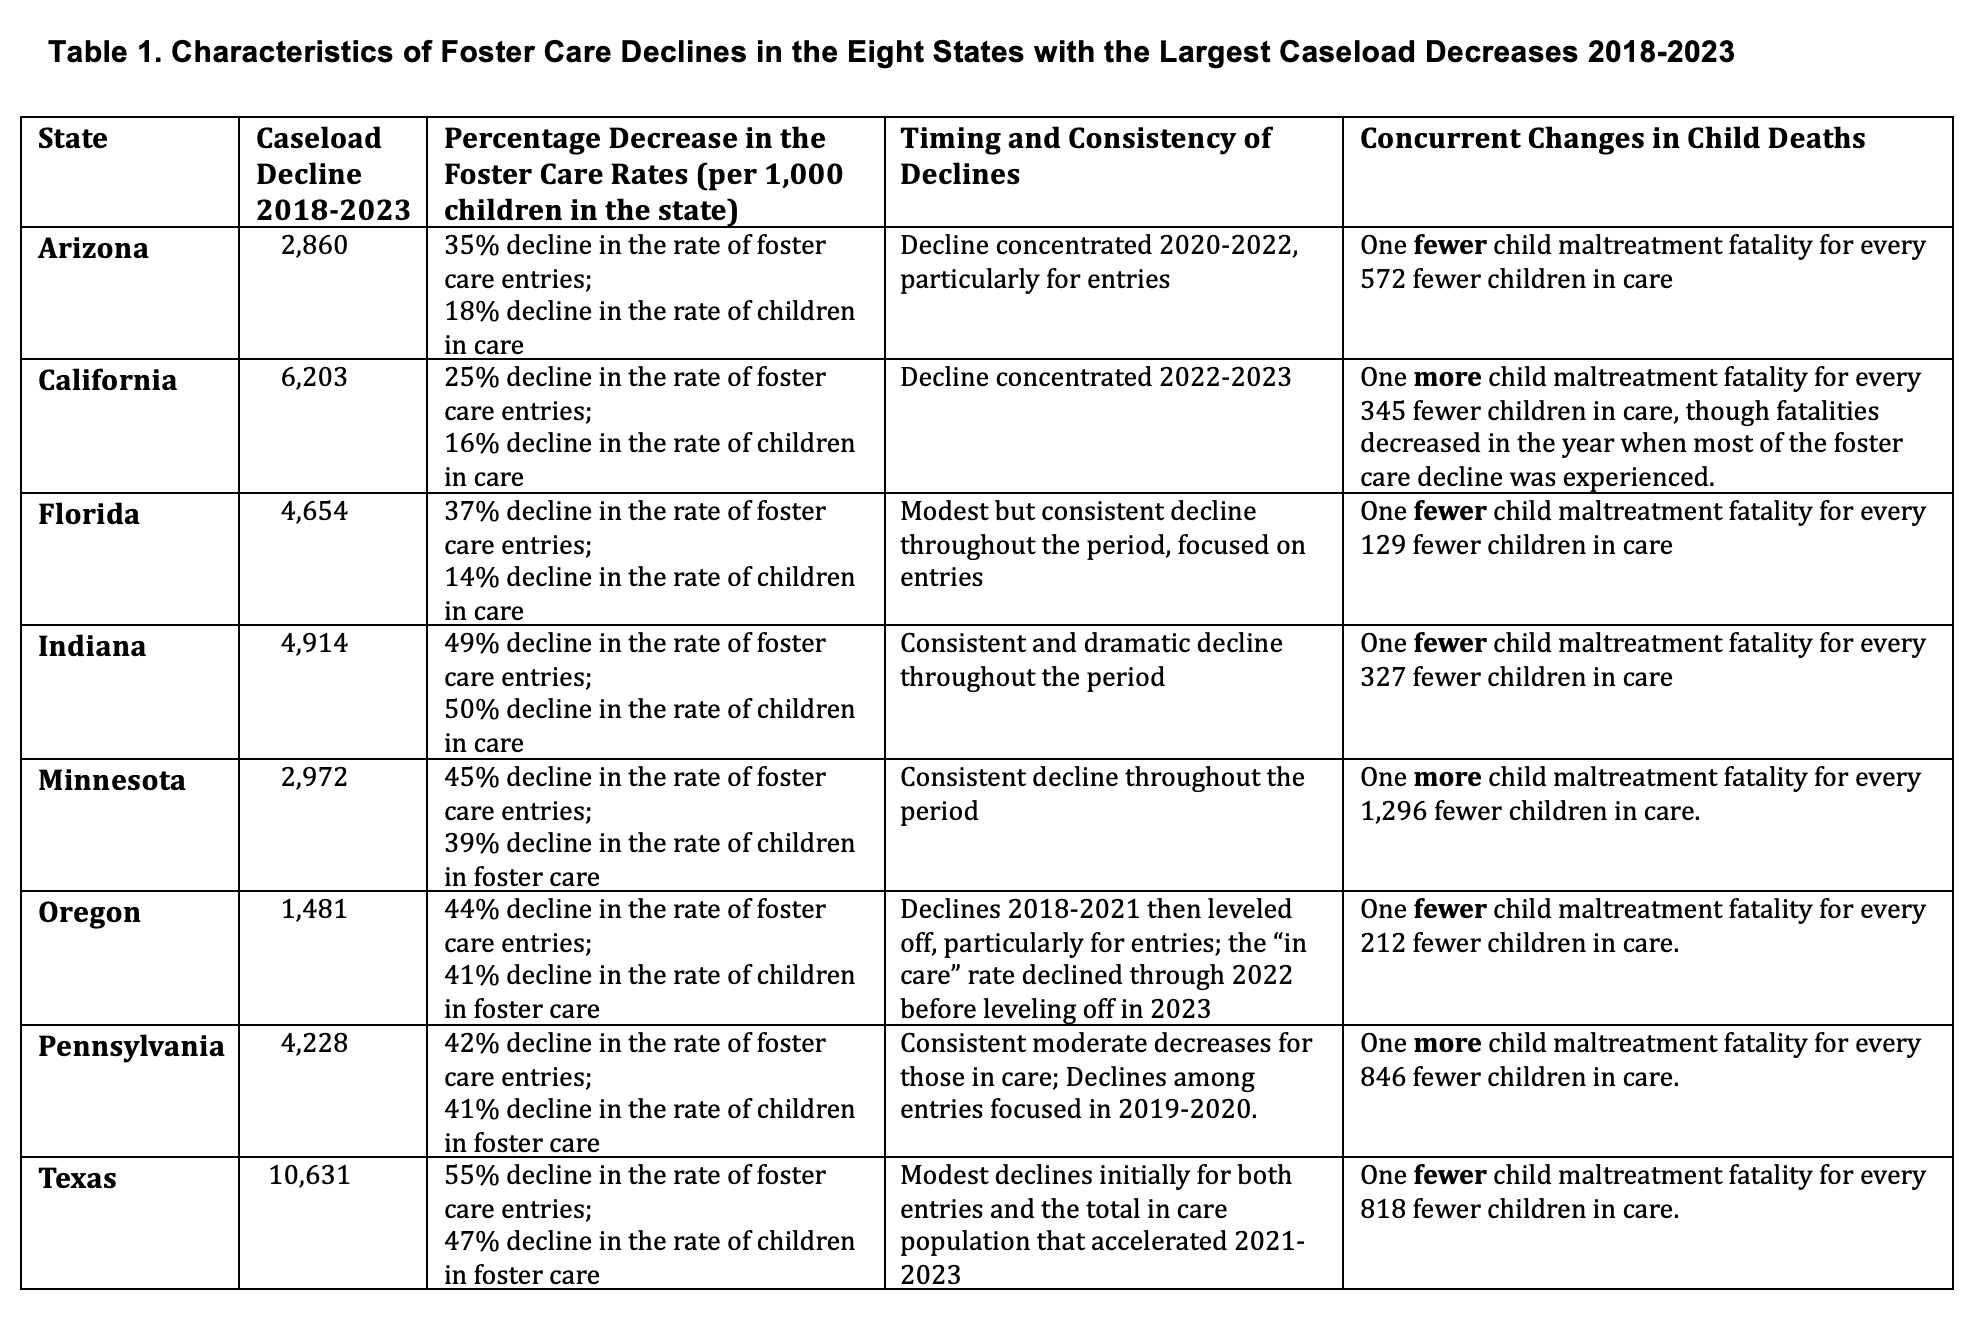
Maltreatment fatality statistics[4] showed more variation.
Three states experienced increases in maltreatment fatalities while five saw decreases.
At the extremes, Florida experienced one fewer maltreatment fatality for every 129 fewer children in foster care, while California saw one additional maltreatment fatality for every 345 fewer children in foster care.
Details on the safety measures for each state appear in Table 1.
Taken together, these indicators do not reveal a uniform safety signal accompanying large foster care declines.
Neither widespread deterioration nor consistent improvement is evident across states.
Instead, safety trends vary alongside disproportionately entry-driven system contraction, underscoring the limits of using caseload decline alone as a proxy for system performance.
What the Largest Declines Do — and Do Not — Tell Us
The eight states examined here account for most of the national decline in foster care. But they do not tell a single story.
Across all eight, reductions were driven primarily by falling entry rates.
What varied was how those entry declines translated into sustained changes in the number of children in care, when those shifts occurred, and what else changed alongside them.
In some states, such as Indiana, Minnesota, and Texas, sustained declines paired with stable or improving safety indicators may reflect genuine system changes that could plausibly persist.
In contrast, states including Arizona, Oregon, Pennsylvania, and California experienced sharper or more time-bound declines – many concentrated during the pandemic period – which raise different interpretive questions.
The point is not that foster care declines cannot represent successful system reform strategies. It is that decline alone is insufficient to establish it.
We haven’t yet looked at programmatic and contextual changes that may have produced reduced foster care entries.
Absent attention to timing, system dynamics, and concurrent safety indicators, aggregate caseload reductions can obscure as much as they reveal.
Whether a decline reflects effective prevention, administrative tightening, or temporary disruption depends on how – and when – it occurred.
If decline is the headline, mechanism is the test. And mechanism is where judgments about success or risk and future policy and practice decisions have to be made.
[1] In our first article we looked at the period 2018 through 2024. This article uses 2018 through 2023 because we wanted to include a look at child maltreatment deaths, data for which is available only through 2023.
[2] Foster Care re-entry data is found on ACF’s Child Welfare Outcomes Report data website here:https://cwoutcomes.acf.hhs.gov/cwodatasite/fourTwo/index/
[3] Maltreatment recurrence data is found on ACF’s Child Welfare Outcomes Report data website here:https://cwoutcomes.acf.hhs.gov/cwodatasite/recurrence/index/
[4] Maltreatment fatalities are reported in ACF’s annual Child Maltreatment reports here: https://acf.gov/cb/data-research/child-maltreatment